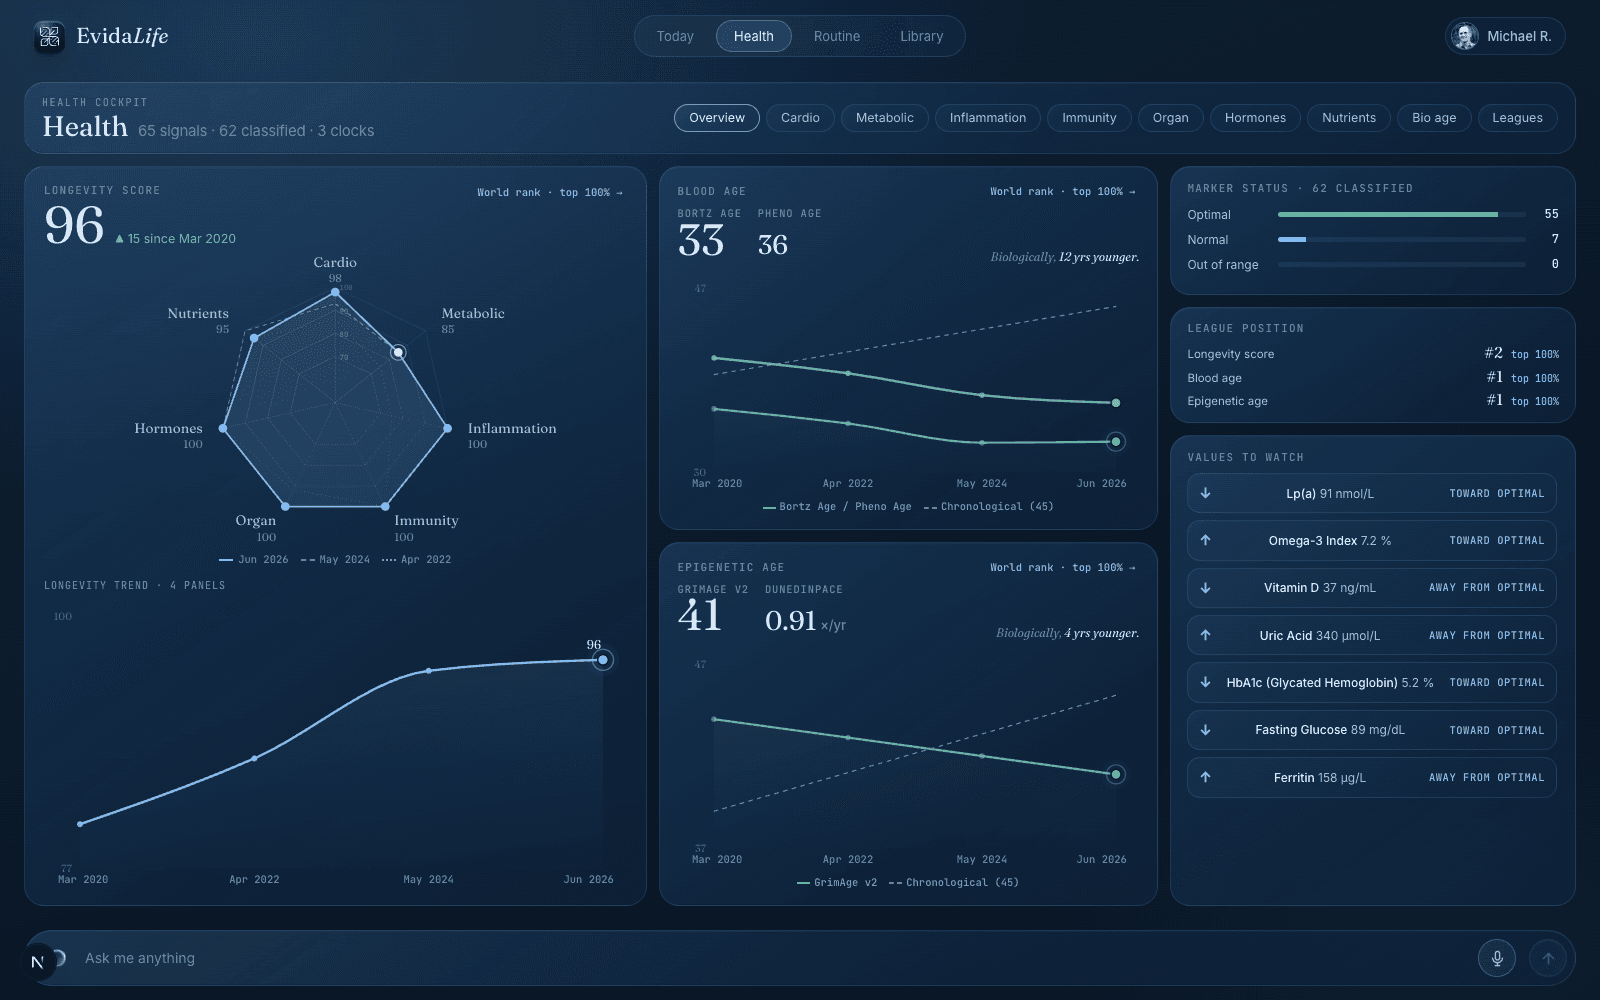
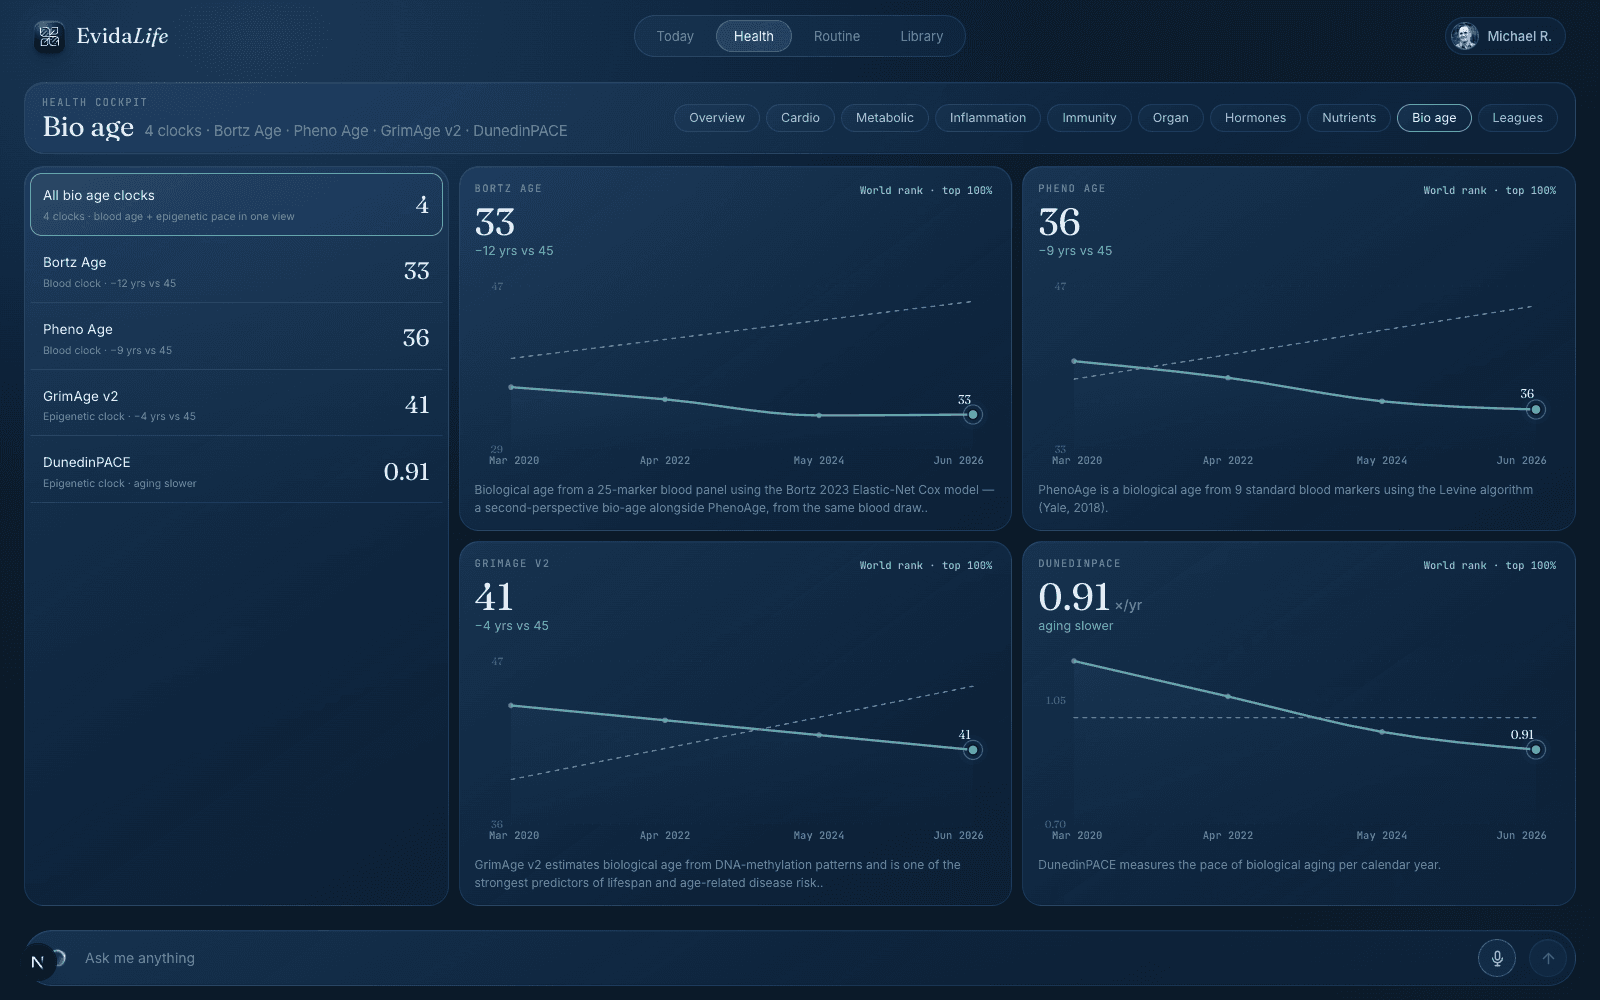
Chronological age 45. Biological age 41.
This is one member's real dossier: four Longevity Complete blood panels, taken across six years. Every number on this page is measured, not modeled. Upload the labs you already have and your own chart begins.
Any lab. Any country. Any format.
GrimAge v2, the epigenetic clock, crossed below calendar age in 2023. The blood clocks agree: Bortz 33, PhenoAge 36, DunedinPACE 0.91 per year.
Normal is not optimal.
The reference range shows what is common in the population. The personal optimal zone shows what the evidence says is best. Decades of peer-reviewed research set the second band, and it is the one your chart is measured against.
Sample-member data. Four real Longevity Complete panels. One member. Not a typical outcome.
Longevity Score 77. Six markers to move first.
The baseline. Read across each band: the dot marks where this member stood, the green shows the personal optimal zone.
- LDL Cholesterol156 mg/dL
- Apolipoprotein B (ApoB)118 mg/dL
- hs-CRP (High-Sensitivity C-Reactive Protein)2.8 mg/L
- HbA1c (Glycated Hemoglobin)5.9 %
- Systolic Blood Pressure138 mmHg
- Resting Heart Rate72 bpm
- Omega-3 Index4.4 %
- Waist Circumference100 cm
Daily Dozen. Coach. Retest.
Eat the evidence
Whole-food, plant-forward nutrition, tracked day to day as habits rather than willpower.
Ask the coach
A coach that reads each panel against 48,000+ peer-reviewed studies and answers in plain language, with citations.
Test again
A fresh panel roughly every 18 to 24 months. Each retest extends the chart and shows what the changes did.
Two markers cross into their personal optimal zone.
Four more markers move.
Sample-member data. Four real Longevity Complete panels. One member. Not a typical outcome.
Longevity Score 96. 55 of 62 markers inside the personal optimal zone.
Longevity board rank 2. Blood age rank 1. Epigenetic age rank 1. Top 100 percent.
- LDL Cholesterol89 mg/dL
- Apolipoprotein B (ApoB)72 mg/dL
- hs-CRP (High-Sensitivity C-Reactive Protein)0.8 mg/L
- HbA1c (Glycated Hemoglobin)5.2 %
- Systolic Blood Pressure116 mmHg
- Resting Heart Rate57 bpm
- Omega-3 Index7.2 %
- Waist Circumference84 cm
Every marker has a personal optimal zone. Watch this one move.
Open a domain to read every marker across the four panels. The band shows the personal optimal zone in green, the line shows six years of change.
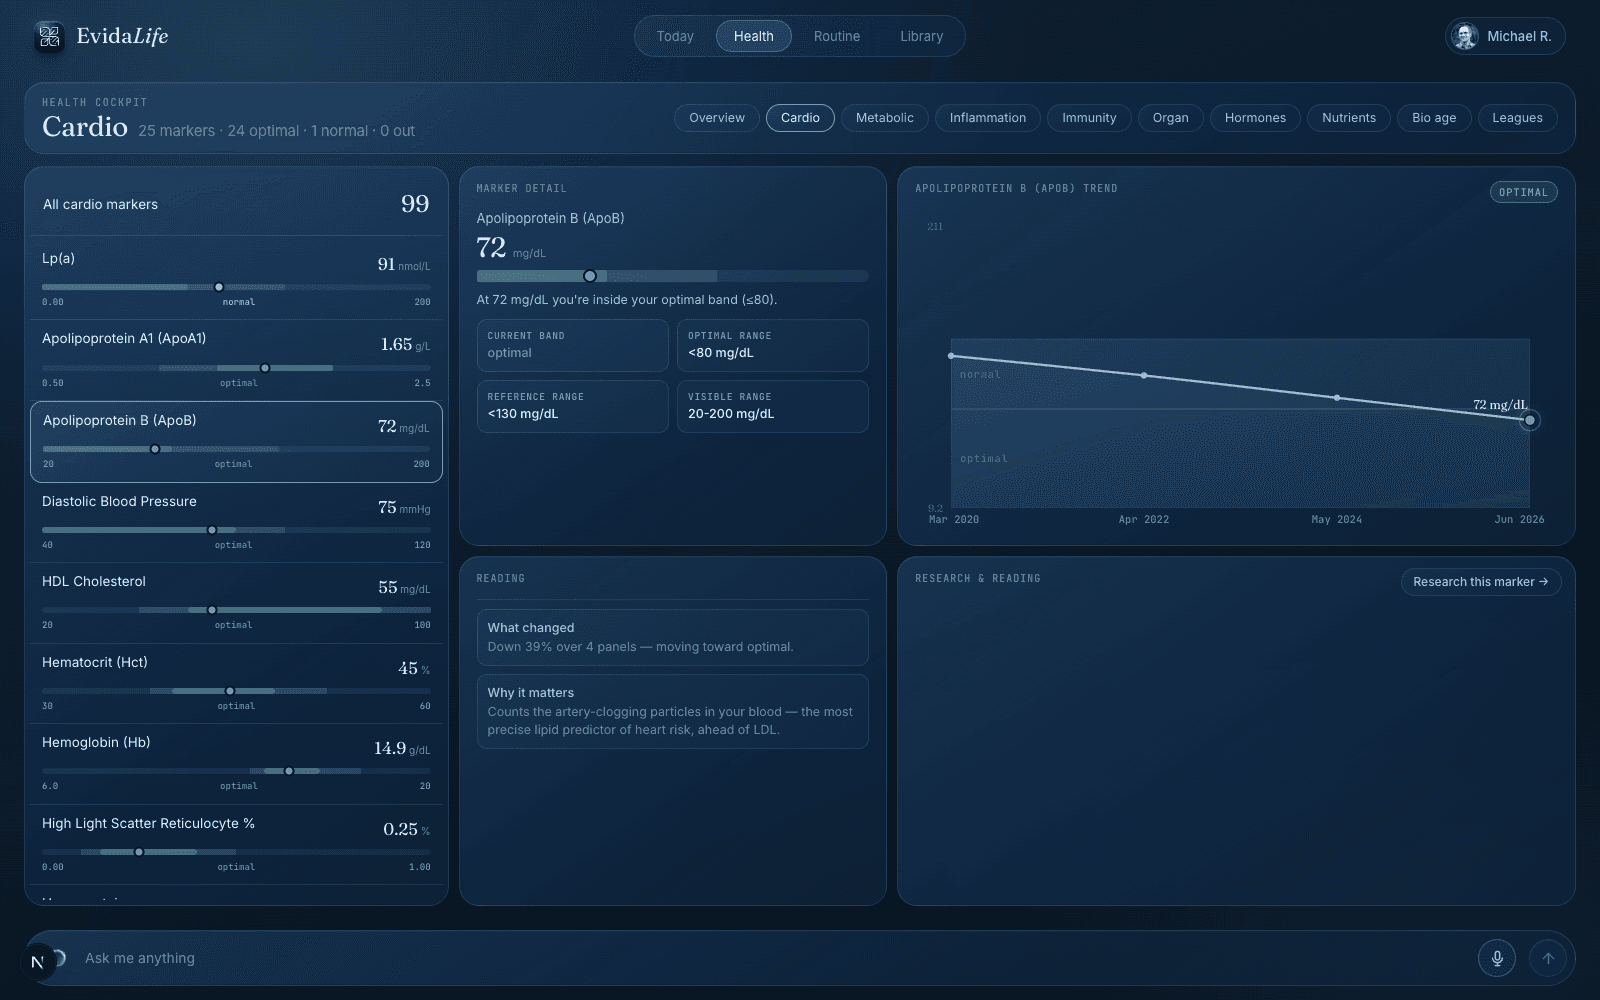
Apolipoprotein B (ApoB)
OptimalApoB counts the artery-clogging particles in your blood. It is the most precise lipid predictor of heart risk, ahead of LDL.
Featured marker, shown open. The rest of the domain is one tap away.
Cardiovascular23/25 optimal
- Apolipoprotein B (ApoB)118 → 72 mg/dLOptimal
- Apolipoprotein A1 (ApoA1)1.35 → 1.65 g/LOptimal
- Diastolic Blood Pressure88 → 75 mmHgOptimal
- HDL Cholesterol42 → 52 mg/dLOptimal
- Hematocrit (Hct)46 → 44.5 %Optimal
- Hemoglobin (Hb)15.4 → 14.9 g/dLOptimal
- High Light Scatter Reticulocyte %0.3 → 0.25 %Optimal
- Homocysteine13.2 → 8.3 µmol/LOptimal
- LDL Cholesterol156 → 89 mg/dLOptimal
- Lp(a)96 → 91 nmol/LNormal
- MCH (Mean Corpuscular Hemoglobin)30 → 30.3 pgOptimal
- MCHC (Mean Corpuscular Hb Concentration)34 → 34 g/dLOptimal
- MCV (Mean Corpuscular Volume)89 → 90 fLOptimal
- Mean Sphered Cell Volume (MSCV)86 → 87 fLOptimal
- Omega-3 Index4.4 → 7.2 %Normal
- Platelet Distribution Width (PDW)13 → 12.3 %Optimal
- Plateletcrit (PCT)0.24 → 0.24 %Optimal
- Platelets265 → 245 x10^9/LOptimal
- Red Blood Cells (RBC)5.1 → 4.9 x10^12/LOptimal
- RDW (Red Cell Distribution Width)13.6 → 12.6 %Optimal
- Resting Heart Rate72 → 57 bpmOptimal
- SpO₂ (Oxygen Saturation)96 → 98 %Optimal
- Systolic Blood Pressure138 → 116 mmHgOptimal
- Total Cholesterol222 → 154 mg/dLOptimal
- Triglycerides178 → 84 mg/dLOptimal
Metabolic2/5 optimal
- Fasting Glucose102 → 89 mg/dLNormal
- Fasting Insulin14 → 5 µU/mLOptimal
- HbA1c (Glycated Hemoglobin)5.9 → 5.2 %Normal
- Uric Acid402 → 340 µmol/LNormal
- Waist Circumference100 → 84 cmOptimal
Inflammation1/1 optimal
- hs-CRP (High-Sensitivity C-Reactive Protein)2.8 → 0.8 mg/LOptimal
Immunity6/6 optimal
- Basophils0.04 → 0.03 x10^9/LOptimal
- Eosinophils0.2 → 0.15 x10^9/LOptimal
- Lymphocytes2.1 → 1.95 x10^9/LOptimal
- Monocytes0.55 → 0.43 x10^9/LOptimal
- Neutrophils4.3 → 3 x10^9/LOptimal
- White Blood Cells (WBC)7.2 → 5.4 x10^9/LOptimal
Organ function9/9 optimal
- Albumin4.3 → 4.6 g/dLOptimal
- ALP (Alkaline Phosphatase)68 → 62 U/LOptimal
- ALT (Alanine Aminotransferase)38 → 18 U/LOptimal
- AST (Aspartate Aminotransferase)32 → 20 U/LOptimal
- Creatinine88 → 84 µmol/LOptimal
- Cystatin C0.85 → 0.76 mg/LOptimal
- GGT (Gamma-Glutamyl Transferase)46 → 18 U/LOptimal
- TSH (Thyroid-Stimulating Hormone)1.8 → 1.5 mIU/LOptimal
- Urea5.5 → 5 mmol/LOptimal
Hormones5/5 optimal
- Cortisol (morning)16 → 11 µg/dLOptimal
- DHEA-S (Dehydroepiandrosterone Sulfate)8.5 → 7.2 µmol/LOptimal
- IGF-1 (Insulin-Like Growth Factor 1)192 → 122 µg/LOptimal
- SHBG (Sex Hormone-Binding Globulin)34 → 46 nmol/LOptimal
- Testosterone (Total)560 → 660 ng/dLOptimal
Nutrients9/11 optimal
- Calcium9.4 → 9.5 mg/dLOptimal
- Ferritin212 → 158 µg/LNormal
- Folate8 → 20 ng/mLOptimal
- Iodine (Urine)140 → 200 µg/LOptimal
- Iron (Serum)20 → 18 µmol/LOptimal
- Magnesium1.9 → 2.2 mg/dLOptimal
- Selenium108 → 120 µg/LOptimal
- Transferrin270 → 285 mg/dLOptimal
- Vitamin B12380 → 620 pg/mLOptimal
- Vitamin D24 → 37 ng/mLNormal
- Zinc12.5 → 14 µmol/LOptimal
Epigenetics0/1 optimal
- DunedinPACE1.16 → 0.91 paceNormal
Fitness1/1 optimal
- Body Weight92 → 78 kgOptimal
The chart, the clocks, the marker.
Upload the labs you already have.
- 01
Upload
A PDF, a CSV, or a photo of the result sheet you already own. From any lab, in any country.
- 02
We classify
Each value is read and normalized to the marker taxonomy across nine clinical domains.
- 03
Your chart begins
You get a Longevity Score and a biological age the same day, and every retest extends the chart.
Prefer a fresh draw? Partner-lab kits are available in select markets. They add convenience, they are not a prerequisite. Self-upload works today, everywhere. /partner-labs
The practical questions.
Do I need to buy a test kit?
No. Upload results from any lab, in any country, in most common formats. Partner-lab kits are optional, for when a fresh local draw is more convenient.
What is a Longevity Score?
A single composite over your classified biomarkers across nine clinical domains, scored against the personal optimal zone rather than the wide reference range. Higher means more of your markers sit where the evidence says is best.
What are the four bio-age clocks?
Bortz Age and PhenoAge are blood-based clocks computed from your panel. GrimAge v2 and DunedinPACE are epigenetic. Together they estimate how fast your body is aging, not just how many birthdays have passed.
Is this medical advice?
No. Evidalife informs and educates. For diagnosis and treatment, talk to your doctor.
Is my data private?
Your blood work is yours. It is stored in the European Union, never sold, and you can export or delete it at any time.
The chart you just read is one member. The next one is yours.
Request your invitationSample-member data. Four real Longevity Complete panels. One member. Not a typical outcome.