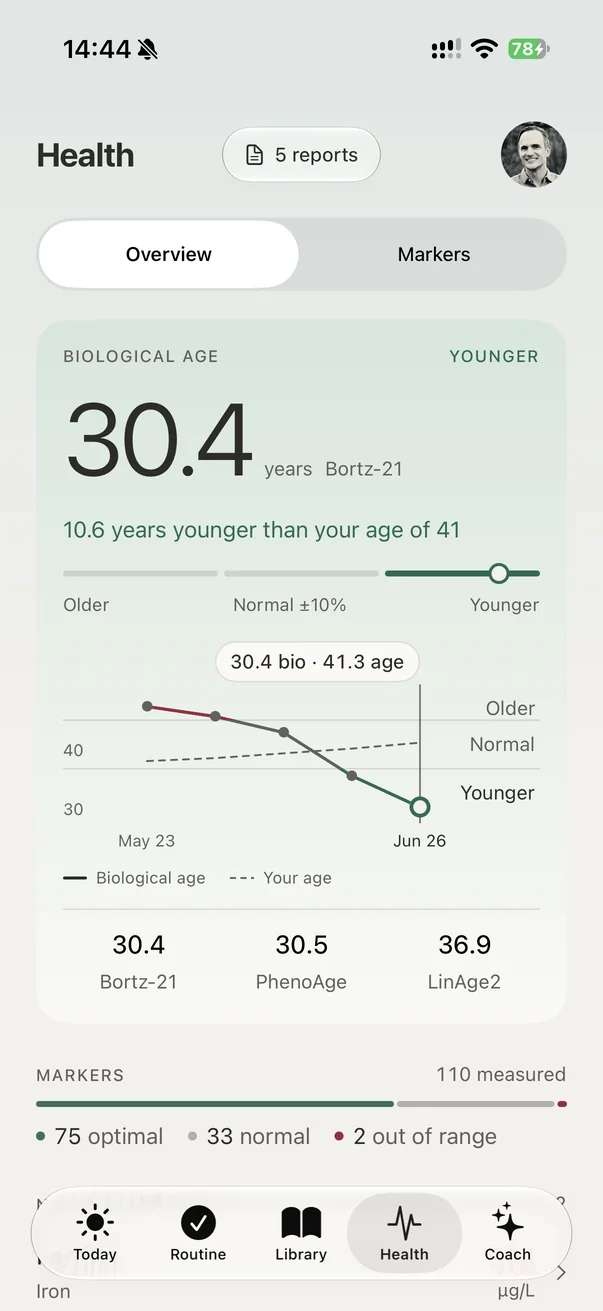
120 markers for every adult, the PhenoAge and Bortz Age clocks included, and one clear picture of where you stand. Every result arrives in the app, explained.
Opening in Switzerland soon. The app is ready now.
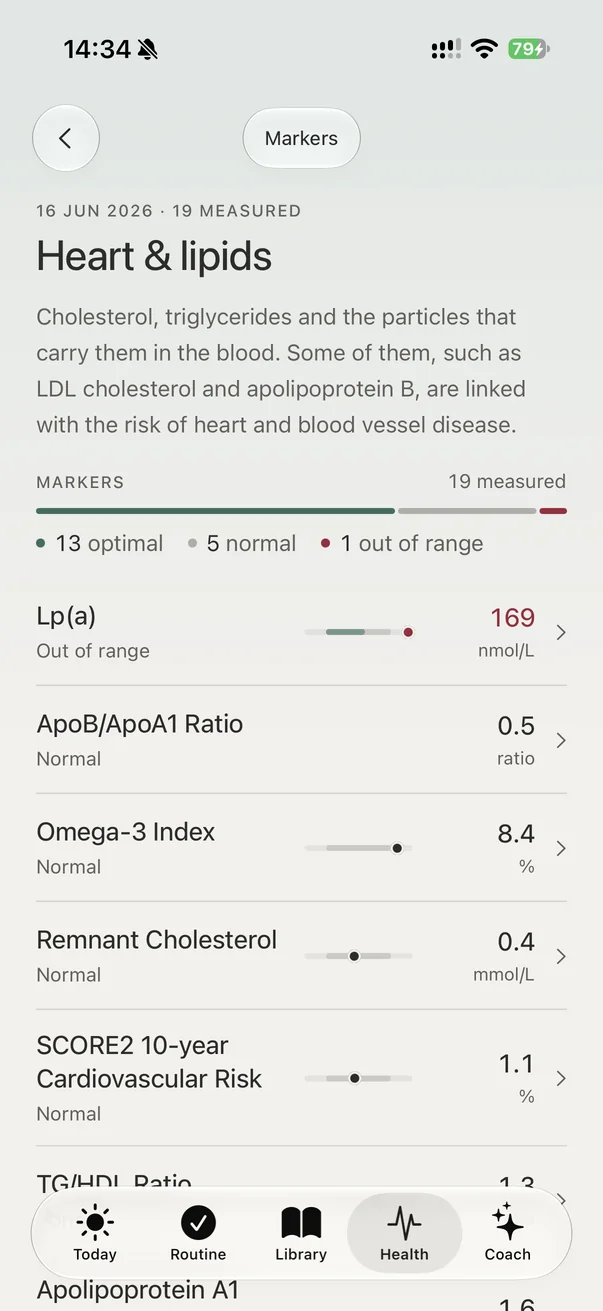
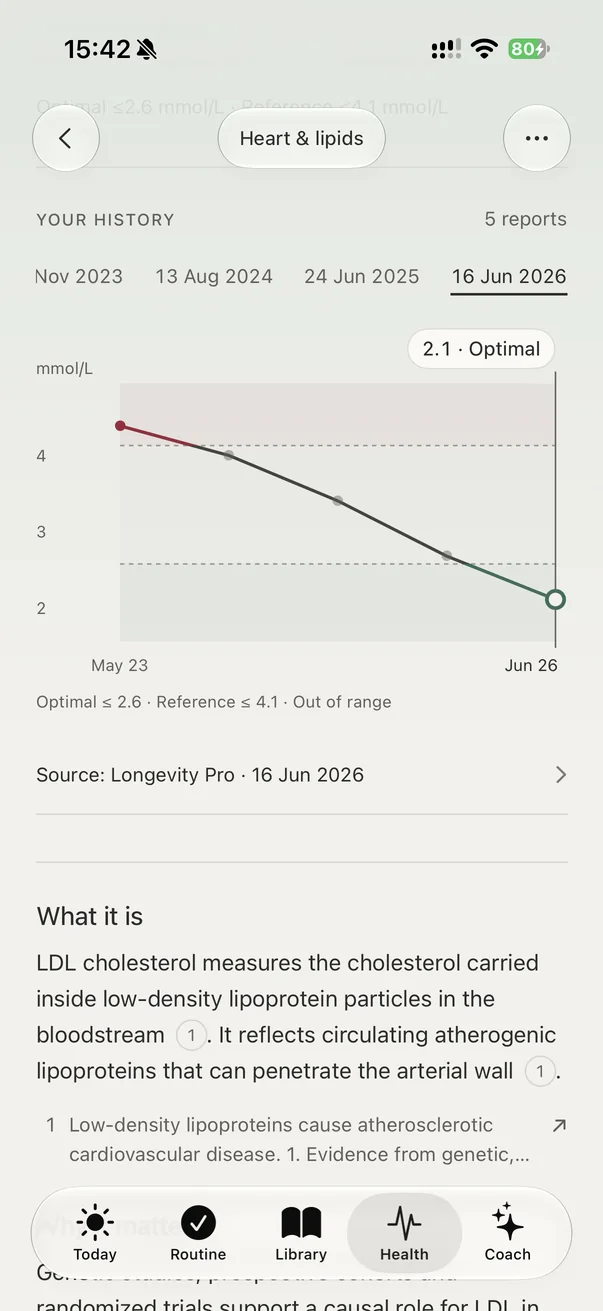
Each marker sits on its own range, in three calm colours, with its history from every visit. Tap one in the app for what it means and the studies behind it.
Optimal Where the research sees the lowest long-term risk.
Normal Inside the lab's reference range, with room to improve.
Review Worth a look, and worth a talk with your doctor.
What it measures
120 markers for every adult, in 14 health areas.
82 measured by the lab, 6 at your visit, 30 calculated from your values and the 2 blood clocks. Open a health area to see every marker in it.
By age, up to 3 more: PREVENT (age 30–79), SCORE2 (age 40–69), and LinAge2 (age 40–84).
Each clock is a published model that turns your results into an age. The app shows where they agree. The Evida League ranks the age quotient: blood age divided by calendar age.
League clock
Bortz blood age
Bortz et al. · Communications Biology, 2023
22values
21 bloodage
Built from
UK Biobank, 306,116 people, followed for up to 14 years
Focus
Risk of death, read from routine blood tests.
Accuracy
Each year older on Bortz: about 10% higher risk of death. The most accurate of the three on blood alone.
In the app
Ranks you in the League.
Best known
PhenoAge
Levine et al. · Aging, 2018
10values
9 bloodage
Built from
US health survey (NHANES)
Focus
Diseases of ageing: heart, cancer, diabetes.
Accuracy
Each year older on PhenoAge: 9% higher risk of death.
In the app
A second, well-tested opinion.
Widest view
LinAge2
Fong et al. · npj Aging, 2025
60values
48 blood3 urine4 vitals4 questionsage
Built from
US health survey (NHANES 1999 to 2002)
Focus
Risk of death and how well your body works: memory, walking speed, daily tasks.
Accuracy
Each LinAge2 year carries the risk of one calendar year. Predicted 10- and 20-year mortality better than PhenoAge.
In the app
Shows which values push your age up. Men and women aged 40 to 84.
What the number means
Same age. Different risk.
The risk of death from any cause roughly doubles every 7 to 8 years of age. Your blood age shows where on that curve your body sits, whatever your birthday says.
Risk of death, any cause
James, 50 yearsblood age45
Daniel, 50 yearsblood age55
Age the body acts like
+150%
Daniel's risk of death from any cause in the years ahead, compared with James. Same age, ten years apart in blood age.
Every 5 years of blood age raises the risk by more than 50%. Every year younger lowers it by about 9%.
Bortz blood age
+10% per year
PhenoAge
+9% per year
LinAge2
one calendar year per year
Calendar age
+9 to 10% per year
How the clocks were tested: out of 100 pairs of people, age and sex alone correctly pick who dies first 73 times, PhenoAge 75 and Bortz 78. No test gets near 100, because chance plays a big part. Sources: Bortz et al., Communications Biology 2023 (22,983 people); Levine et al., Aging 2018; Fong et al., npj Aging 2025. LinAge2 was tested in US data, so it is not in the 100-pairs comparison. The curve is illustrative; James and Daniel are examples, not real members. The Bortz figures are for the published model; the app uses its 21-marker version.
When they disagree, look at the values behind it
Example · calendar age 52
52 calendarBortz 48PhenoAge 49LinAge2 55
The two blood-only clocks agree. LinAge2 also reads blood pressure, so here it sits higher. The app names the values that pull it up.
Health overview
Five checks, explained simply.
The app turns your results into five checks. Here they are with James and Daniel, two example men who are both 50. Tap a check to see what it means.
Heart health
One blood test. Two risk calculators.
Two risk calculators, one from Europe and one from the USA, read the same blood test. Both answer one question: out of 100 people with values like yours, how many will have a heart attack or a stroke in the next 10 years? The American one also counts heart failure.
Chance of heart disease or stroke in the next 10 years
2.5×
Daniel's risk compared with James's. Out of 100 men like Daniel, about 5 have a heart attack or stroke in the next 10 years. Out of 100 men like James, about 2.
Both calculators agree, so the difference is real. SCORE2 is made for ages 40 to 69, PREVENT for 30 to 79.
The number can't tell whether it will hit you. It tells you how many of 100 people with exactly your values will have a heart attack or stroke in 10 years. What separates James and Daniel is blood pressure and blood fats, and both can change.
Read the full explanationJames and Daniel are examples, not real members. Their numbers are made up to show how the checks work.
Plaque
Count the particles, not the cholesterol.
Cholesterol travels through your blood in tiny delivery trucks. These trucks are the particles. When there are too many, some get stuck in the artery wall and pile up, like dirt in a pipe. That pile is plaque. ApoB counts the trucks. Lp(a) is a sticky kind of truck you inherit from your parents.
Where James and Daniel sit
Lp(a)nmol/L
Inherited riskHigh Lp(a), kept in check by low ApoB.
Highest riskMany particles, more of them sticky.
Lowest riskFew particles, little Lp(a).
Too much ApoBFixable: food, weight, medicine.
Daniel with ApoB 70Daniel · 138 · 160James · 72 · 1812504080160
ApoB, mg/dL · how many particles can build plaque
Lower ApoB: same genes, safer corner
2×
Daniel has almost twice as many particles that can build plaque: ApoB 138 against 72 mg/dL. And far more of his are the sticky kind: Lp(a) 160 against 18 nmol/L.
Lp(a) is 70 to 90 % inherited and barely changes, so one measurement is enough. ApoB is the part Daniel can change. With his high Lp(a), a low ApoB would move him from “Highest risk” to “Inherited risk”: clearly safer, but not as safe as James. That is why his ApoB target is stricter.
The more particles there are and the stickier they are, the faster plaque grows. Daniel can't change his Lp(a), so lowering his ApoB is what he can do.
Read the full explanationJames and Daniel are examples, not real members. Their numbers are made up to show how the checks work.
Diabetes
Blood sugar is the last number to rise.
Insulin is a messenger. It tells your cells to open their doors and let sugar in. When the cells stop listening well, the body sends more and more messengers to keep blood sugar normal. For years the sugar looks fine, but the extra insulin already gives it away.
How it usually unfolds
4×
Daniel's body works about four times as hard as James's to keep the same normal blood sugar.
His sugar values still count as normal. He is in the early window, where food, exercise and weight help most.
A standard check-up calls both men normal: glucose under 100 mg/dL, HbA1c under 5.7 %. Only the insulin shows how hard Daniel's body is already working.
Read the full explanationJames and Daniel are examples, not real members. Their numbers are made up to show how the checks work.
Fatty liver
Fat first. Scars much later.
Your liver is the body's storeroom. When more food comes in than you use, it stores the extra as fat. That doesn't hurt, and about one adult in four has a fatty liver. But a storeroom that stays overfull for years gets irritated, and hard scars can grow in its walls.
Two steps on one map
90
Daniel's Fatty Liver Index: he very likely has fat in his liver. James's 16 makes it unlikely.
Both FIB-4 values are under 1.3, so advanced scarring is unlikely for both. For Daniel this is the stage where the fat can still shrink back.
Fat can still shrink back. If the storeroom stays overfull for years, it gets irritated and scars can form, and scars heal much more slowly. That is why step 2 is checked every time.
Read the full explanationJames and Daniel are examples, not real members. Their numbers are made up to show how the checks work.
Kidney health
Two estimates. One filter.
Your kidneys are a filter. They clean your blood and send the waste out with the urine. Two questions matter: how fast does the filter work, and does it leak? Most check-ups only ask the first one, and measure it only one way.
Creatinine (open) and cystatin C (filled)
−24
Daniel's estimate from cystatin C is 24 lower than the one from creatinine: 68 against 92. James's two estimates agree: 100 and 98.
Albumin leaks into Daniel's urine too (UACR 45 mg/g). Doctors speak of kidney disease only when a change lasts more than 3 months, so the next step is a repeat test.
Going by creatinine alone, Daniel looks as healthy as James. Cystatin C and the urine test show his filter is slower and leaking. A repeat test in 3 months is worth it.
Read the full explanationJames and Daniel are examples, not real members. Their numbers are made up to show how the checks work.
How it works
From the app to your results, in four steps.
1
Get the app
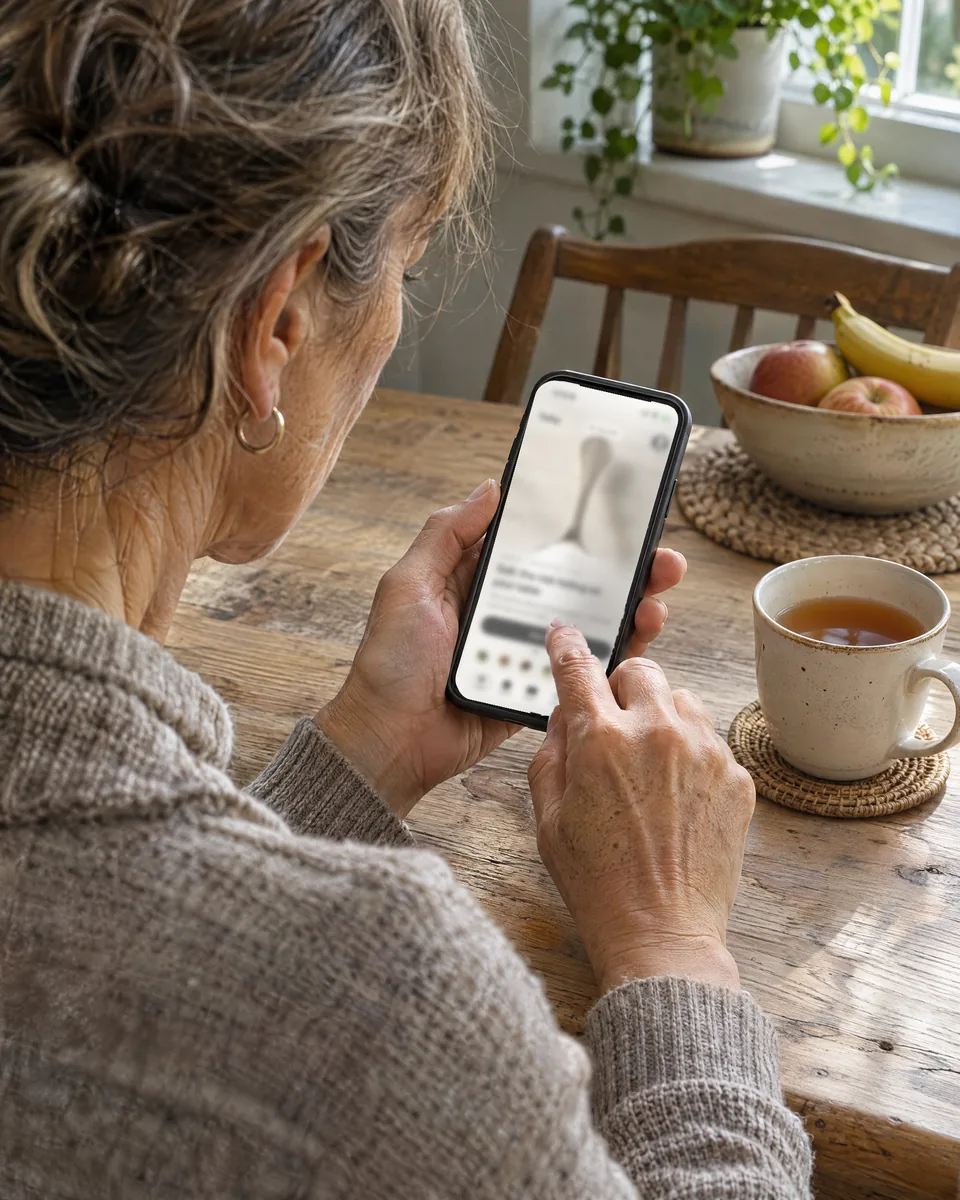
Your account, your results and your history live in the iPhone app. Free plan for everyone.
2
Buy the panel
Here or in the app, one payment. Your lab voucher appears in your account right away.
3
Visit a partner lab
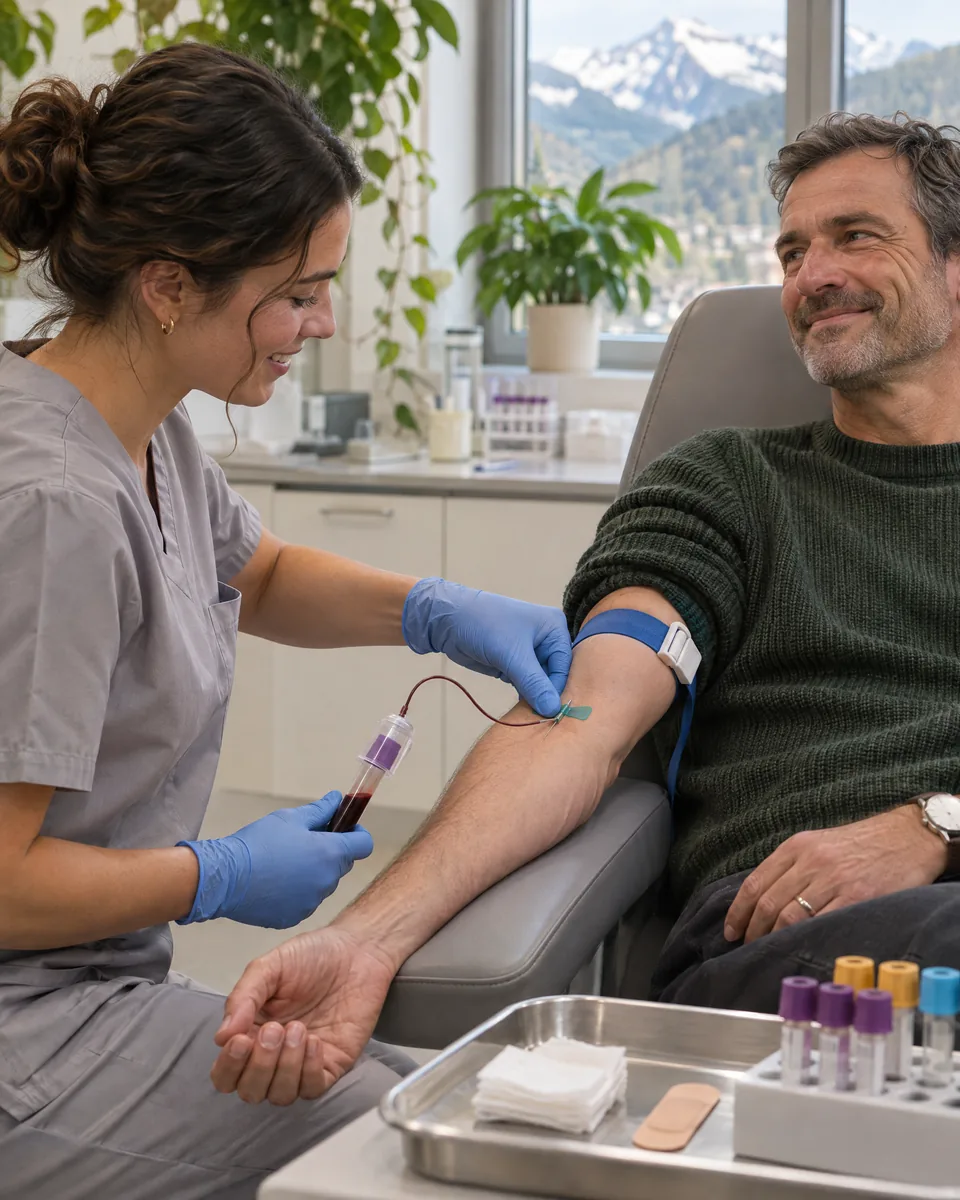
Fast for 12 hours, then blood, urine and vitals in one visit. Nothing to pay at the lab.
4
See it in Health
Your results appear in the app as soon as the lab releases them, every marker explained and your clocks updated.
Partner labs
Switzerland first.
Accredited labs take blood, urine and vitals the same way for everyone, so your results stay comparable over the years. The first labs open in Switzerland; more countries follow.
You don't need our panel to use EvidaLife. Upload a PDF or a photo of any lab report in the app, from any country, and every marker is placed in its range and explained. The panel is simply the easiest way to get all 120 in one visit, at one price.