

Health overview
Five checks from one blood test, explained simply.
From your Longevity Panel, the app builds five checks: heart health, plaque, diabetes, fatty liver and kidney health. Here is what each one means, in plain words and pictures, shown with two men who are both 50: James and Daniel.
James and Daniel are examples, not real members. Their numbers are made up to show how the checks work.
Heart health · 10 years
One blood test. Two risk calculators.
Two risk calculators, one from Europe and one from the USA, read the same blood test. Both answer one question: out of 100 people with values like yours, how many will have a heart attack or a stroke in the next 10 years? The American one also counts heart failure.
Chance of heart disease or stroke in the next 10 years
2.5×
Daniel's risk compared with James's. Out of 100 men like Daniel, about 5 have a heart attack or stroke in the next 10 years. Out of 100 men like James, about 2.
Both calculators agree, so the difference is real. SCORE2 is made for ages 40 to 69, PREVENT for 30 to 79.
The numbers, in plain words
JamesDaniel
SCORE2the European calculator
Out of 100 people with values like yours, how many will have a heart attack or stroke in the next 10 years.
low to moderateunder 5
high5 to 10
very high10 and above
PREVENTthe American calculator
Almost the same question, but it also counts heart failure. It can also look 30 years ahead: 14 in 100 for James, 31 in 100 for Daniel.
lower is better
How they fit together. Daniel's risk is pushed up most by his blood pressure (146 mmHg, James has 118) and by too little of the good HDL cholesterol (39 mg/dL, James has 62). Both can improve, and his risk falls with them. The SCORE2 zones shown are the ones for ages 50 to 69; PREVENT has no named zones, but US guidelines draw two lines for this number, at 7.5% and at 20%.
James and Daniel · both 50 · examples
Picture 100 men like each of them.

James50 years old
1.9% in 10 years
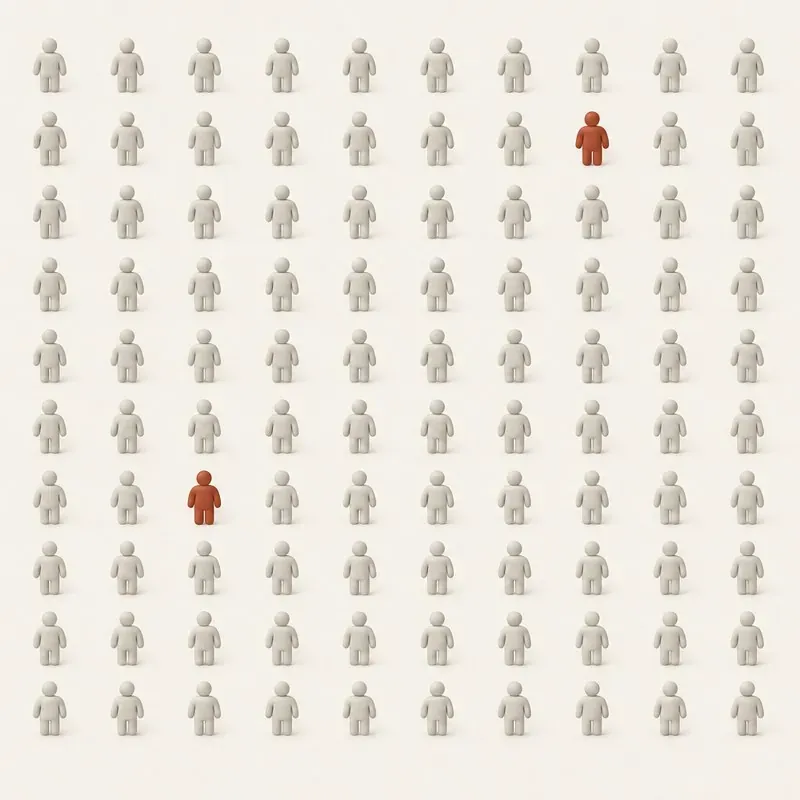
About 2 in 100. Picture 100 men with exactly James's values. In the next 10 years about 2 of them (red) have a heart attack or stroke, and 98 don't. His blood pressure is 118, his HDL 62.

Daniel50 years old
4.7% in 10 years
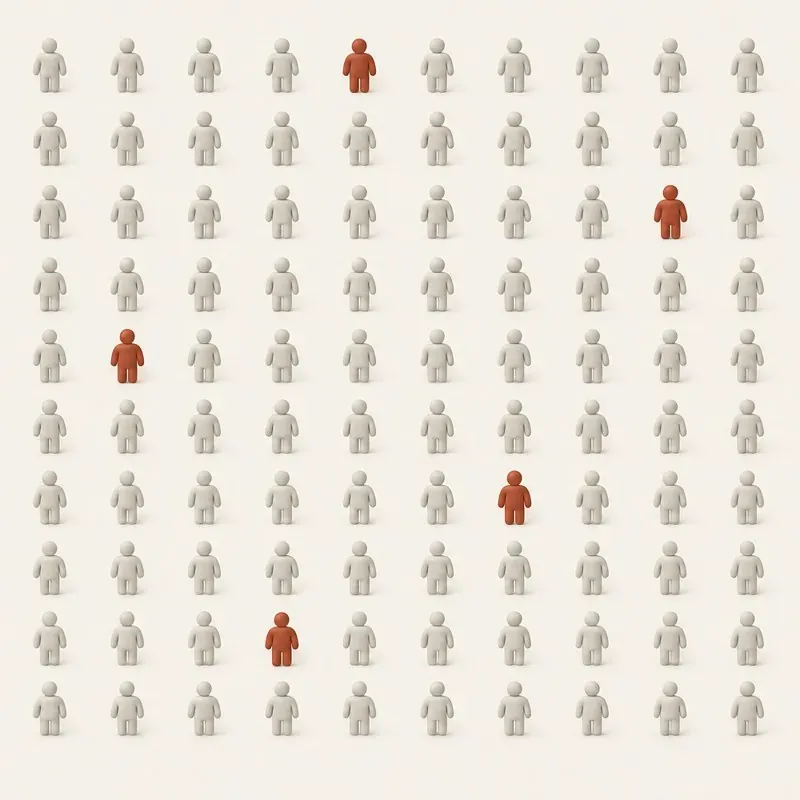
About 5 in 100. Picture 100 men like Daniel: about 5 of them are affected. His blood pressure is 146, his HDL 39, his BMI 30.5. Neither man smokes.
The number can't tell whether it will hit you. It tells you how many of 100 people with exactly your values will have a heart attack or stroke in 10 years. What separates James and Daniel is blood pressure and blood fats, and both can change.
Sources: SCORE2 Working Group, Eur Heart J 2021; Khan et al., Circulation 2024 (PREVENT). James and Daniel are examples, not real members. Their numbers are made up to show how the checks work.
Plaque
Count the particles, not the cholesterol.
Cholesterol travels through your blood in tiny delivery trucks. These trucks are the particles. When there are too many, some get stuck in the artery wall and pile up, like dirt in a pipe. That pile is plaque. ApoB counts the trucks. Lp(a) is a sticky kind of truck you inherit from your parents.
Where James and Daniel sit
2×
Daniel has almost twice as many particles that can build plaque: ApoB 138 against 72 mg/dL. And far more of his are the sticky kind: Lp(a) 160 against 18 nmol/L.
Lp(a) is 70 to 90 % inherited and barely changes, so one measurement is enough. ApoB is the part Daniel can change. With his high Lp(a), a low ApoB would move him from “Highest risk” to “Inherited risk”: clearly safer, but not as safe as James. That is why his ApoB target is stricter.
The numbers, in plain words
JamesDaniel
ApoBcounts the particles
Every truck that can get stuck carries exactly one ApoB, like a number plate. Count the plates and you know how many trucks there are.
optimalup to 80
normal80 to 120
highover 120
Lp(a)inherited
A truck with an extra sticky hook. Your genes decide how many you have, so one test in your life is enough.
optimalup to 75
normal75 to 125
highover 125
How they fit together. The sticky Lp(a) trucks are part of the ApoB count. ApoB says how many trucks there are, Lp(a) how many of them are sticky. Together they put you in one of the four corners above. You can't change your genes, but food, weight and, if needed, medicine lower ApoB.
James and Daniel · both 50 · examples
What reaches their artery walls.
James50 years old
72ApoB, mg/dL
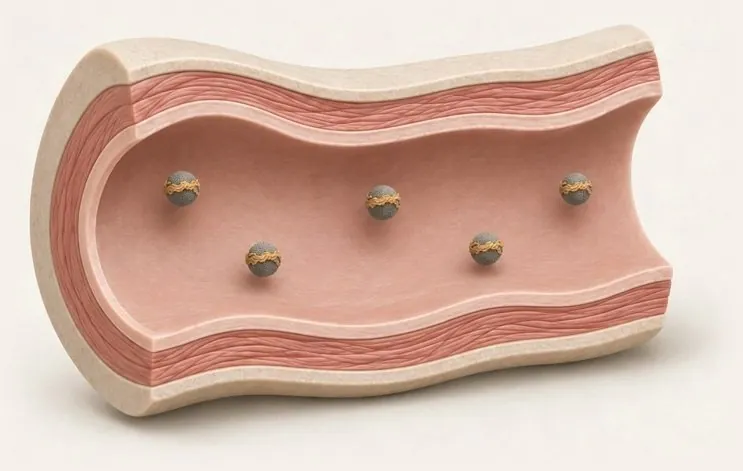
Lowest risk. Few particles, almost all of the ordinary kind. Like everyone, he has some Lp(a), but only about 1 in 100 of his particles. His artery wall stays smooth.
Daniel50 years old
138ApoB, mg/dL
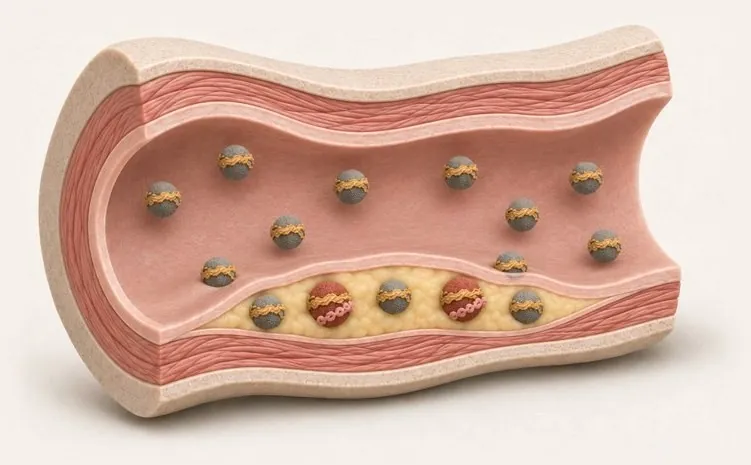
Highest risk. Twice as many particles, and some are the sticky red Lp(a). Whole particles slip into the wall and stay there. Over the years, the grey and the red ones together build his plaque.
The more particles there are and the stickier they are, the faster plaque grows. Daniel can't change his Lp(a), so lowering his ApoB is what he can do.
Who is who in your blood
Four kinds of particles carry fat and cholesterol through your blood.
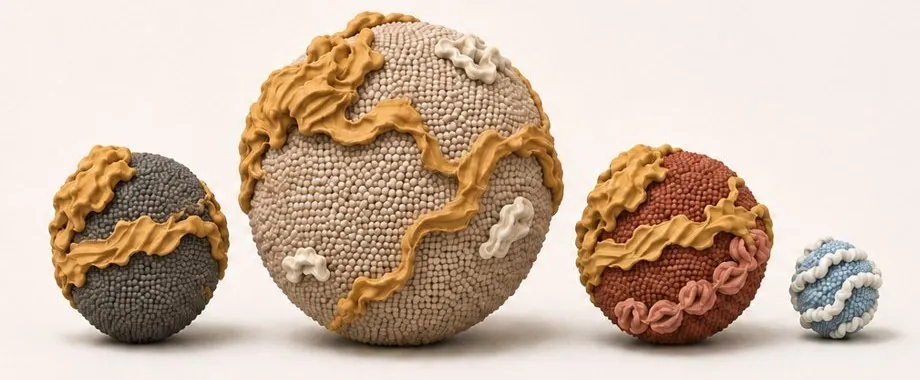
ApoB, the ochre bandEvery particle that can build plaque wears exactly one. So counting ApoB counts the particles that can get stuck in your arteries. That is why ApoB says more than LDL cholesterol.
LDLThe main delivery truck. It brings cholesterol from the liver to the body's cells.Builds plaque when there are too many.
VLDL and remnantsThe big truck for fat. It carries triglycerides from the liver; the leftovers (remnants) behave like LDL.Builds plaque.
Lp(a)An LDL with an extra sticky chain attached (pink). How much you have is set by your genes.Builds plaque and promotes clots. Barely changes in life.
HDLThe small return truck. It takes extra cholesterol back to the liver. It carries a different protein (white), not ApoB.Does not build plaque. A high HDL alone does not protect you.
Illustration, sizes approximate.
Why plaque matters
What a pile in the pipe can do.
- The pipe gets narrow.
Less blood gets through. In the heart that can cause chest pain on effort, in the legs pain when walking.
- A plaque can tear.
Then a blood clot forms on it, like a scab, and can block the artery within minutes. In the heart that is a heart attack, in the brain a stroke.
- Pressure makes it worse.
High blood pressure pushes the trucks into the wall harder, so plaque grows faster. That is why blood pressure counts in the heart risk.
Thresholds: ESC/EAS 2019 (ApoB), EAS 2022 consensus (Lp(a)). Corner names as in the app. Corners drawn even; the scale changes at 80 and 125. James and Daniel are examples, not real members. Their numbers are made up to show how the checks work.
Diabetes
Blood sugar is the last number to rise.
Insulin is a messenger. It tells your cells to open their doors and let sugar in. When the cells stop listening well, the body sends more and more messengers to keep blood sugar normal. For years the sugar looks fine, but the extra insulin already gives it away.
How it usually unfolds
4×
Daniel's body works about four times as hard as James's to keep the same normal blood sugar.
His sugar values still count as normal. He is in the early window, where food, exercise and weight help most.
The numbers, in plain words
JamesDaniel
HOMA-IRstep 1 · insulin effort
How hard your body works to keep blood sugar normal. It is calculated from the next two numbers, and it changes first.
optimalup to 1.5
normal1.5 to 2.5
raisedover 2.5
Fasting Insulinstep 1 · the messengers
How many insulin messengers your body needed this morning.
optimalup to 8
normal8 to 25
highover 25
Fasting Glucosestep 2 · sugar this morning
Your blood sugar before breakfast. It only rises years later.
optimalunder 85
normal85 to 100
prediabetes100 and above
HbA1cstep 3 · 3-month sugar
Sugar sticks to your red blood cells, a bit like sugar on a spoon. HbA1c shows the average of the last 3 months. It rises last.
optimalup to 5.4
normal5.4 to 5.6
raisedover 5.6
How they fit together. Read it like a story. First the messengers get louder (insulin and HOMA-IR). Years later the morning sugar rises, and the 3-month sugar comes last. Daniel is at the start of the story, the best moment to change how it ends.
James and Daniel · both 50 · examples
Same normal sugar. Four times the effort.
James50 years old
1.0HOMA-IR
4.7insulin, µU/mL
86glucose, mg/dL
5.1 %HbA1c
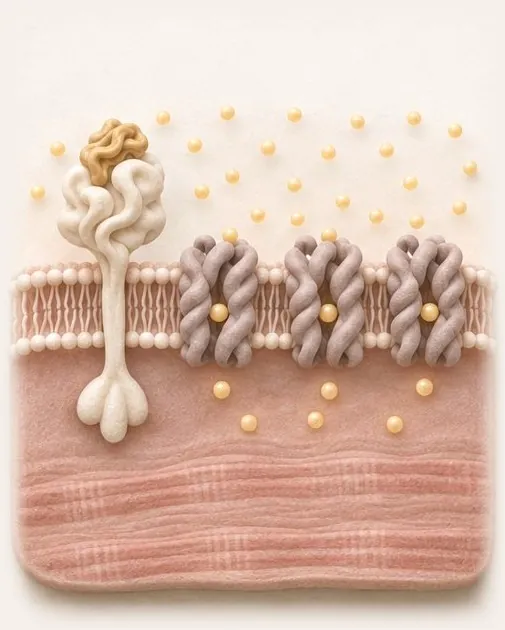
Insulin works. Insulin docks on its receptor. The receptor tells the muscle cell to bring its GLUT4 doors to the surface, and sugar walks in. A little insulin is enough.
Daniel50 years old
4.2HOMA-IR
17.2insulin, µU/mL
99glucose, mg/dL
5.6 %HbA1c
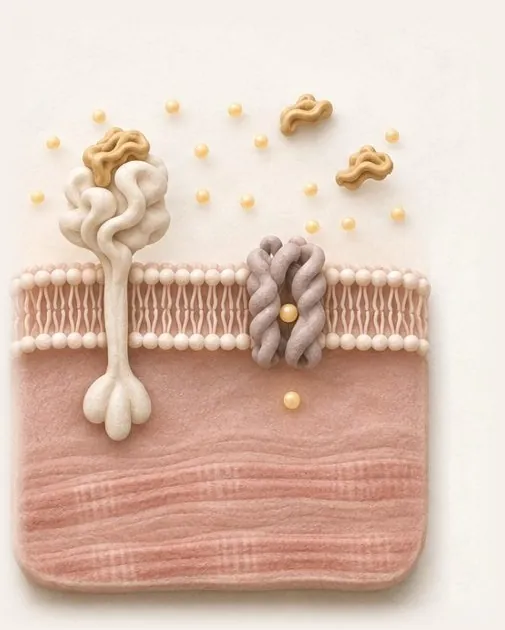
Insulin resistance. His cells hear the signal less well, so fewer doors reach the surface. His pancreas answers with extra insulin, almost four times as much, and for now that keeps his blood sugar normal.
A standard check-up calls both men normal: glucose under 100 mg/dL, HbA1c under 5.7 %. Only the insulin shows how hard Daniel's body is already working.
Curve shape after Tabák et al., Lancet 2009 (Whitehall II), illustrative. Muscle-cell pictures are simplified illustrations, not to scale; fat cells work the same way. James and Daniel are examples, not real members. Their numbers are made up to show how the checks work.
Fatty liver
Fat first. Scars much later.
Your liver is the body's storeroom. When more food comes in than you use, it stores the extra as fat. That doesn't hurt, and about one adult in four has a fatty liver. But a storeroom that stays overfull for years gets irritated, and hard scars can grow in its walls.
Two steps on one map
90
Daniel's Fatty Liver Index: he very likely has fat in his liver. James's 16 makes it unlikely.
Both FIB-4 values are under 1.3, so advanced scarring is unlikely for both. For Daniel this is the stage where the fat can still shrink back.
The numbers, in plain words
JamesDaniel
Fatty Liver Indexstep 1 · fat score
Is the storeroom full of fat? Made from triglycerides, waist, BMI and one liver enzyme (GGT).
unlikelyunder 30
unclear30 to 60
likely60 and above
FIB-4step 2 · scar score
Are scars growing in the walls? Made from age, two liver enzymes (AST, ALT) and platelets.
unlikelyunder 1.3
unclear1.3 to 2.67
likely2.67 and above
How they fit together. Fat comes first and can shrink back within a few months. Scars come only after years, and heal slowly. So the fat score asks "is it full?", and the scar score asks "is it already damaged?". From 1.3 on (2.0 from age 65) a doctor checks the liver with a stiffness scan (elastography); above 2.67 a liver specialist takes over.
James and Daniel · both 50 · examples
One storeroom tidy, one overfull.
James50 years old
16Fatty Liver Index
80triglycerides, mg/dL
86 cmwaist
0.95FIB-4, scarring unlikely
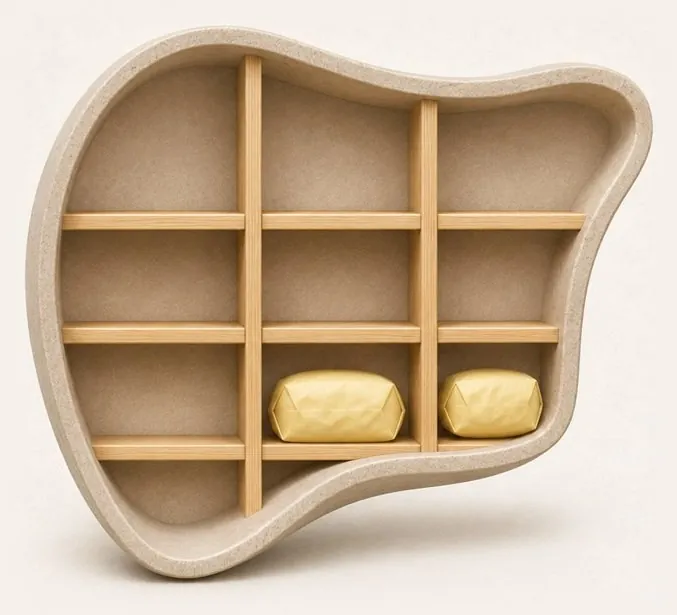
Almost empty shelves. James uses most of what he eats, so little is stored as fat.
Daniel50 years old
90Fatty Liver Index
210triglycerides, mg/dL
106 cmwaist
1.14FIB-4, scarring unlikely
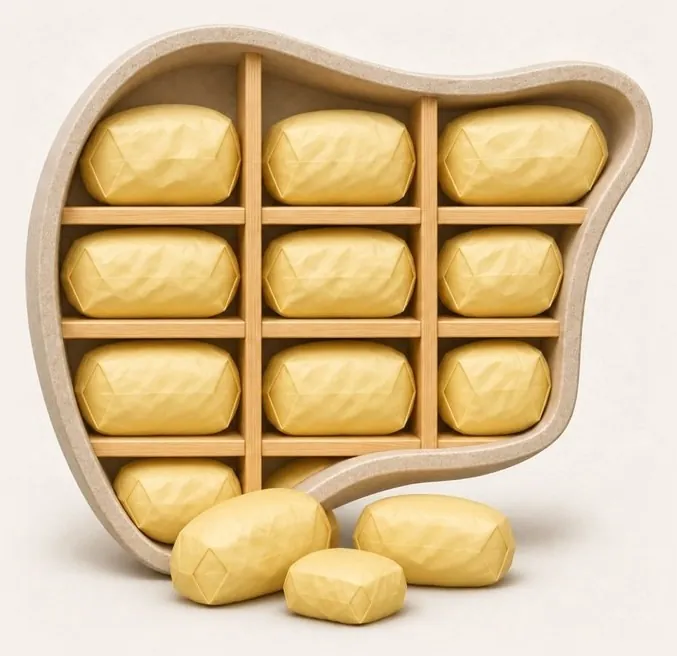
Every shelf full. More sugar and fat came in than Daniel used, and the surplus is stored in his liver. It doesn't hurt, so he feels nothing. GGT 62. No sign of scarring yet.
Fat can still shrink back. If the storeroom stays overfull for years, it gets irritated and scars can form, and scars heal much more slowly. That is why step 2 is checked every time.
Why scars matter
One storeroom, three stages.
- Tidy
Like James. Fat score low, scar score low. Nothing to do.
- Full of fat
Like Daniel today. Fat score high, scar score still low. Fat can shrink back within months with less sugar, less alcohol and some weight loss.
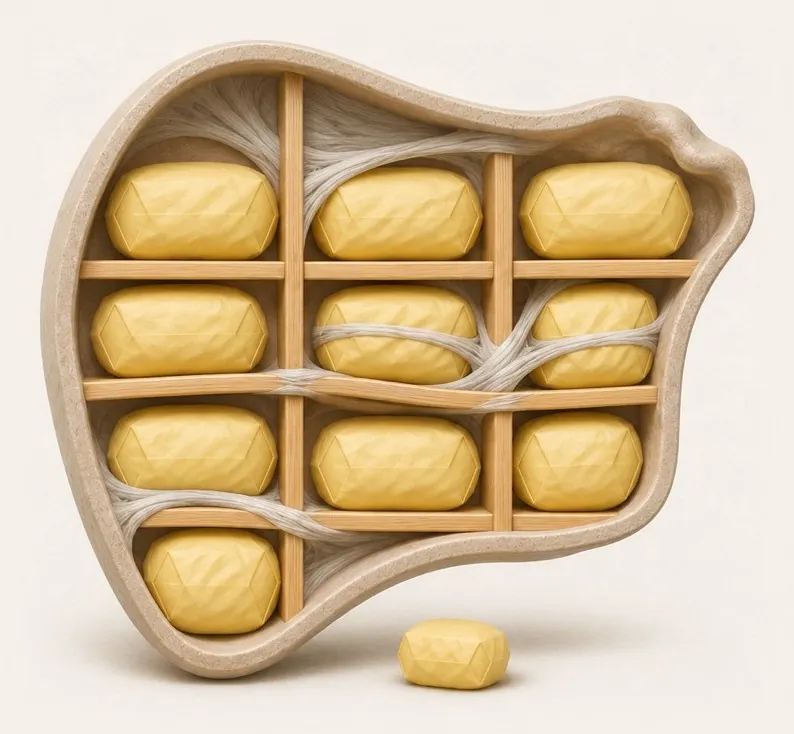 Years later: scars
If the storeroom stays overfull for years, hard scar bands grow in the walls and the liver shrinks. Scars heal slowly. The scar score (FIB-4) watches for this stage.
Illustrations, not to scale. Neither man is at stage 3.
Thresholds: Bedogni et al. 2006 (FLI); EASL-EASD-EASO 2024 MASLD guideline (FIB-4 pathway: from 1.3, or 2.0 from age 65, the next step is elastography; above 2.67, referral to a specialist). James and Daniel are examples, not real members. Their numbers are made up to show how the checks work.
Kidney health
Two estimates. One filter.
Your kidneys are a filter. They clean your blood and send the waste out with the urine. Two questions matter: how fast does the filter work, and does it leak? Most check-ups only ask the first one, and measure it only one way.
Creatinine (open) and cystatin C (filled)
−24
Daniel's estimate from cystatin C is 24 lower than the one from creatinine: 68 against 92. James's two estimates agree: 100 and 98.
Albumin leaks into Daniel's urine too (UACR 45 mg/g). Doctors speak of kidney disease only when a change lasts more than 3 months, so the next step is a repeat test.
The numbers, in plain words
JamesDaniel
eGFRfilter speed
How much blood the filter cleans each minute. The lab works it out from creatinine (made by muscles) or cystatin C (made by all cells). Using both together is most accurate.
G3 or lowerunder 60
G260 to 90
G190 and above
UACRleak test
Albumin is a protein the body wants to keep. If it shows up in the urine, the filter has a small leak.
A1under 30
A230 to 300
A3300 and above
How they fit together. Speed and leak together give the kidney grade: G for speed, A for leak. James is G1·A1, the best. Daniel is G2·A2: a bit slower, with a small leak. Creatinine alone made Daniel look fine. Doctors test again after 3 months before they call it kidney disease.
James and Daniel · both 50 · examples
Creatinine says both are fine.
James50 years old
G1 · A1
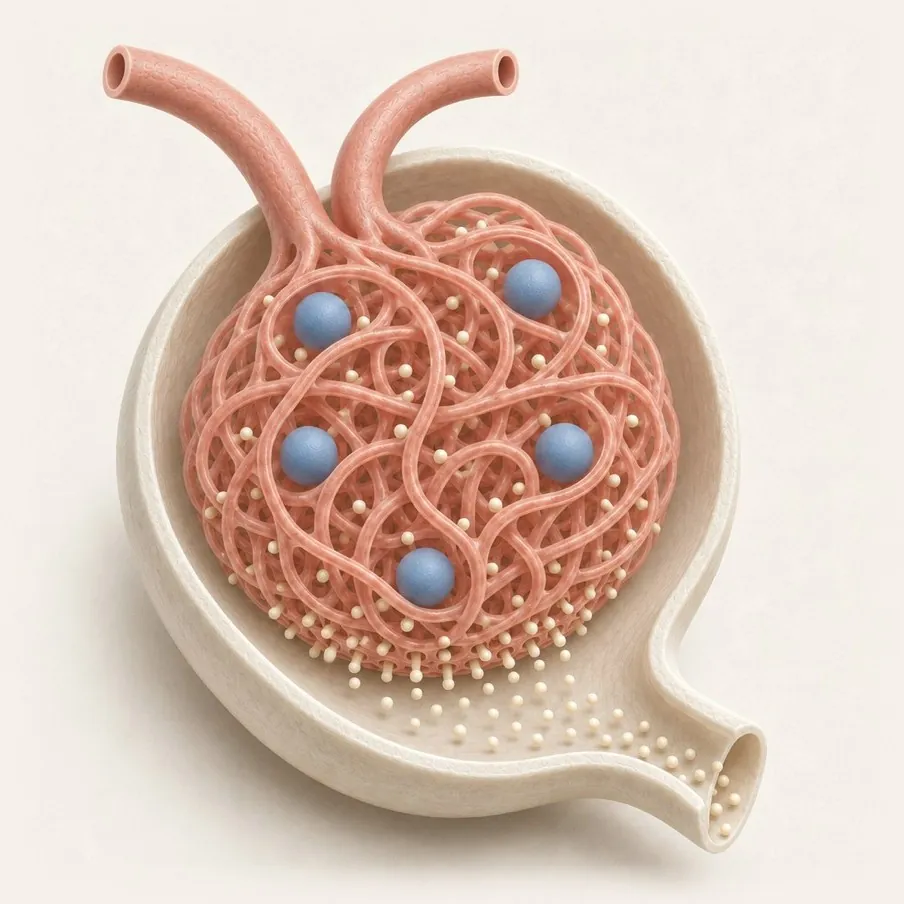
A fast filter that doesn't leak. Lots of waste (the small beads) flows out. The blue albumin balls, a protein the body keeps, all stay inside. Both estimates agree; UACR 5 mg/g.
Daniel50 years old
G2 · A2
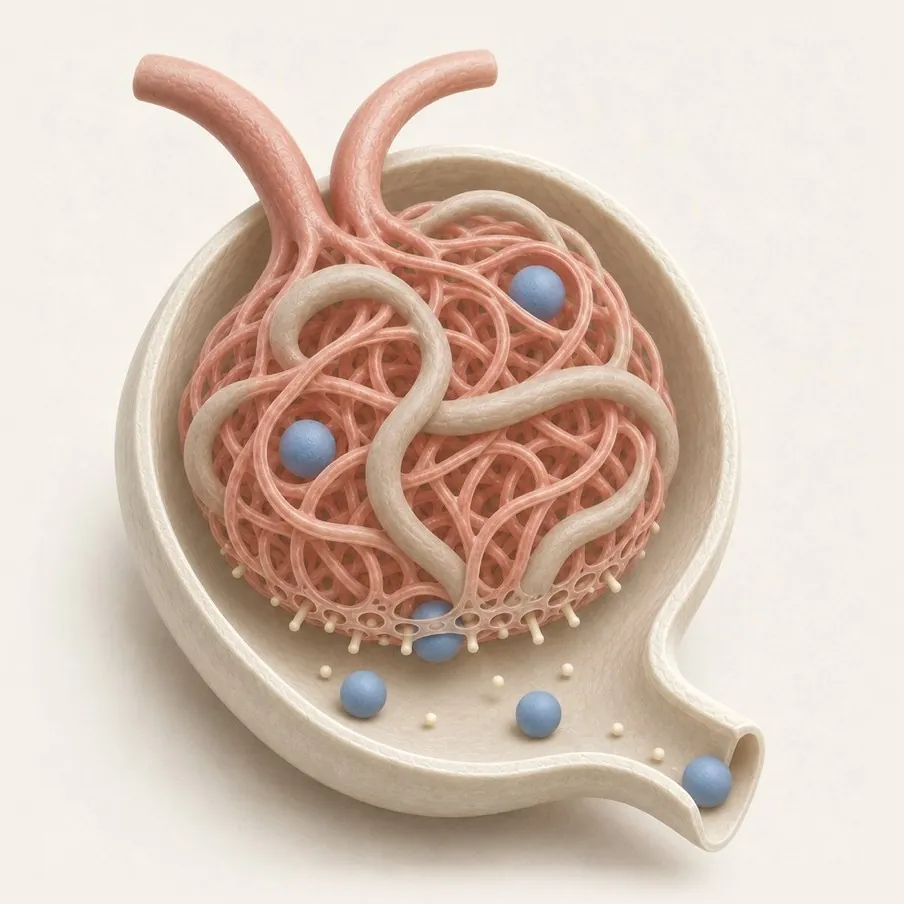
Slower, and leaking. Some loops have gone stiff, so less waste gets out, and a few blue albumin balls slip through into the urine. Creatinine says 92, cystatin C says 68; UACR 45 mg/g.
Going by creatinine alone, Daniel looks as healthy as James. Cystatin C and the urine test show his filter is slower and leaking. A repeat test in 3 months is worth it.
KDIGO 2024 CKD guideline; Inker et al., NEJM 2021 (CKD-EPI). The eGFR bar shows the combined estimate, approximate for these examples. Zones on the bars are the app's own optimal and reference ranges; the risk scores use their guideline zones. James and Daniel are examples, not real members. Their numbers are made up to show how the checks work.